Logs, metrics and traces — what each one is actually for
The "three pillars" of observability answer different questions. Knowing which one to reach for saves hours during an incident.
During an incident, the question is never "do we have data?" It's "can we answer this question fast?" Logs, metrics and traces each answer different questions.
Metrics: is something wrong?
Metrics are cheap numbers aggregated over time: request rate, error rate, latency percentiles, queue depth. They're ideal for dashboards and alerts.
Alert on symptoms users feel — error rate and latency — not on every CPU spike.
Traces: where is it wrong?
A trace follows a single request across services, broken into timed spans. When p99 latency jumps, a trace shows whether the time went to the database, a downstream API, or your own code.
Logs: why is it wrong?
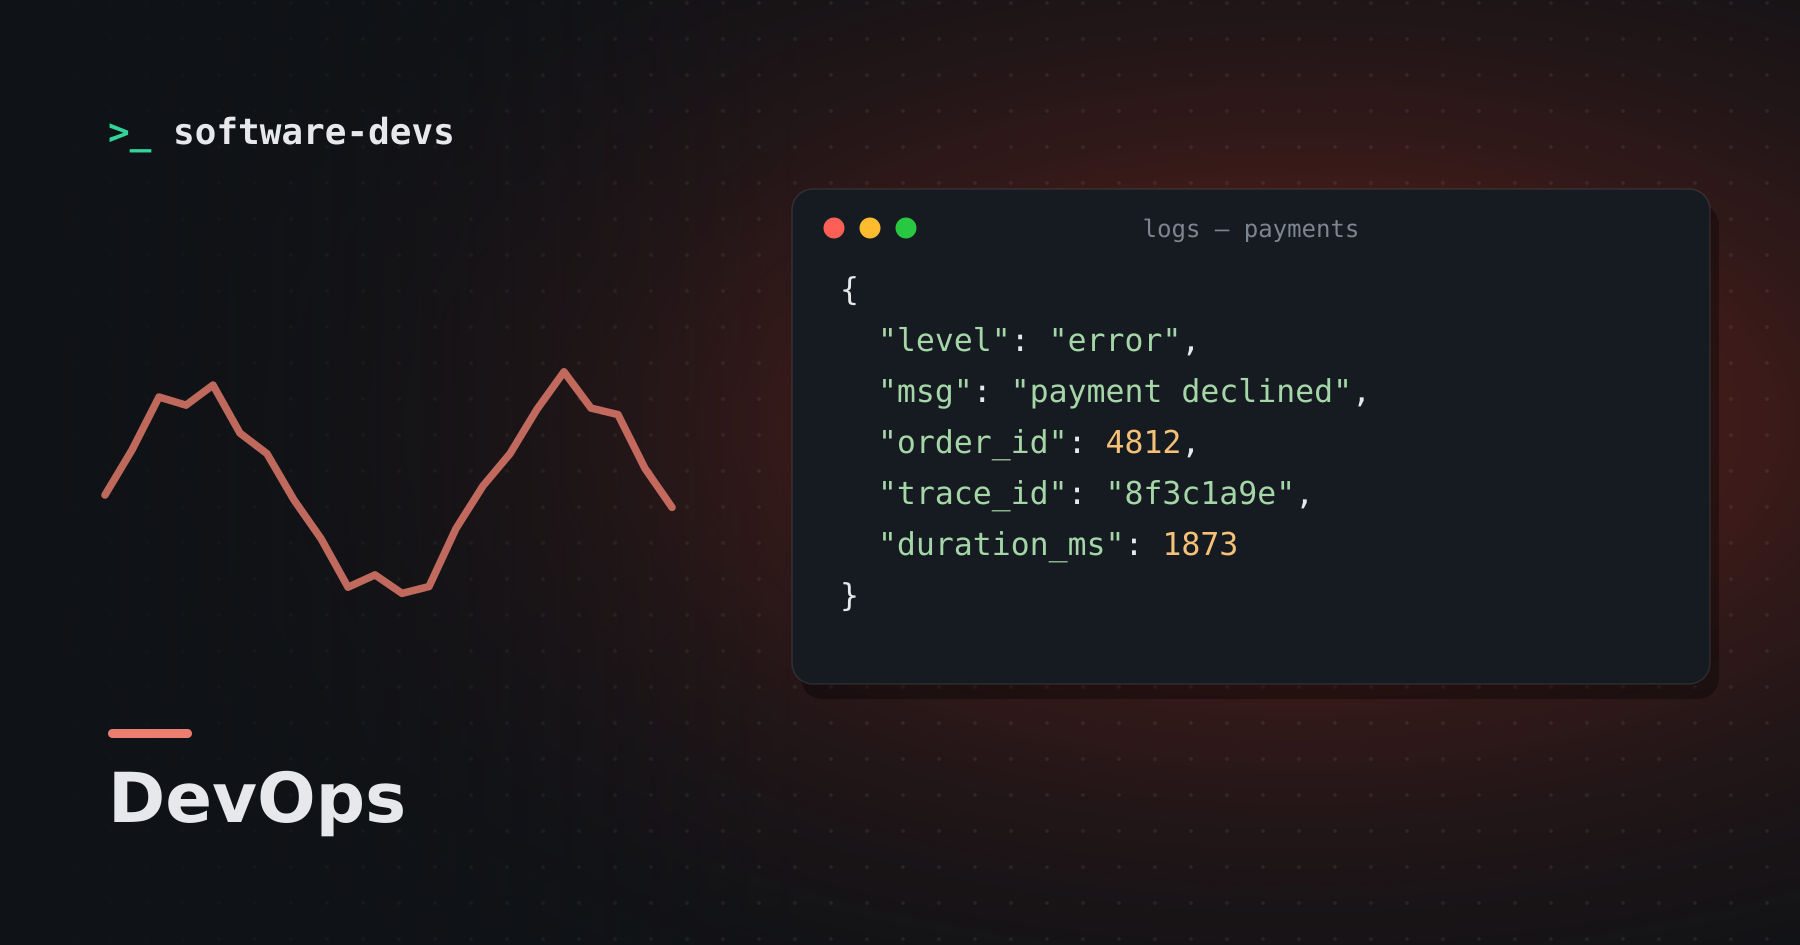
Logs carry the detail: the exact error, the parameters, the stack trace. Structured logs (JSON with consistent keys) turn them from text to grep into data you can query.
{"level":"error","msg":"payment declined","order_id":4812,"trace_id":"8f3c...","provider":"acme"}
Tie them together
The trick is correlation. Put the trace_id in every log line, and attach exemplar trace IDs to latency metrics. Then the workflow becomes:
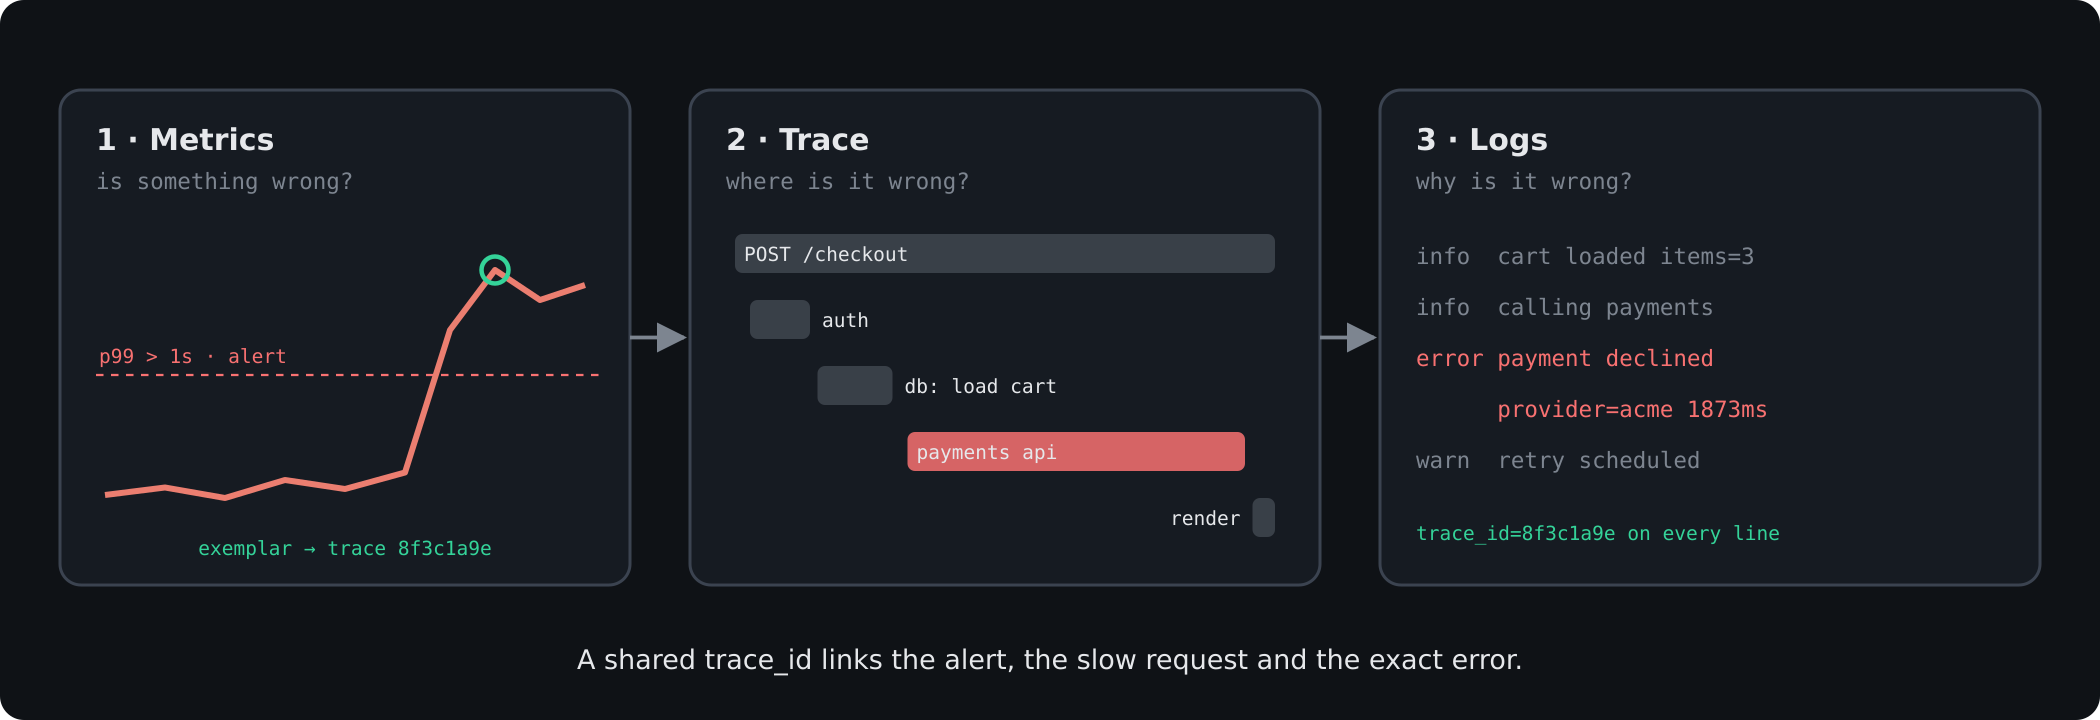
- A metric alert fires.
- You jump to a slow trace from that window.
- You read the logs for the failing span.
Vendor-neutral instrumentation standards make this portable, so you can change backends without re-instrumenting your code.