How garbage collectors work, and why your app pauses
Garbage collection frees you from manual memory management, but it isn't free. A tour of the main algorithms and what they mean for latency.
In garbage-collected languages — Java, Go, C#, JavaScript, Python, Ruby — you allocate objects and the runtime frees them when they're no longer reachable. How it decides, and when, affects memory use and latency.
Reachability
An object is alive if it can be reached from a root: a local variable on the stack, a global or a CPU register. Everything else is garbage, even if objects still point at each other.
Reference counting
Each object counts how many references point to it; at zero, it's freed immediately. Predictable and simple, but it can't reclaim cycles (A points to B, B points to A) on its own, and updating counts costs time. CPython uses reference counting plus a cycle detector.
Mark and sweep
- Mark: start from the roots and mark everything reachable.
- Sweep: free everything unmarked.
Handles cycles naturally. The cost is the pause while marking, and memory fragmentation over time — which compacting collectors fix by moving live objects together.
Generational collection
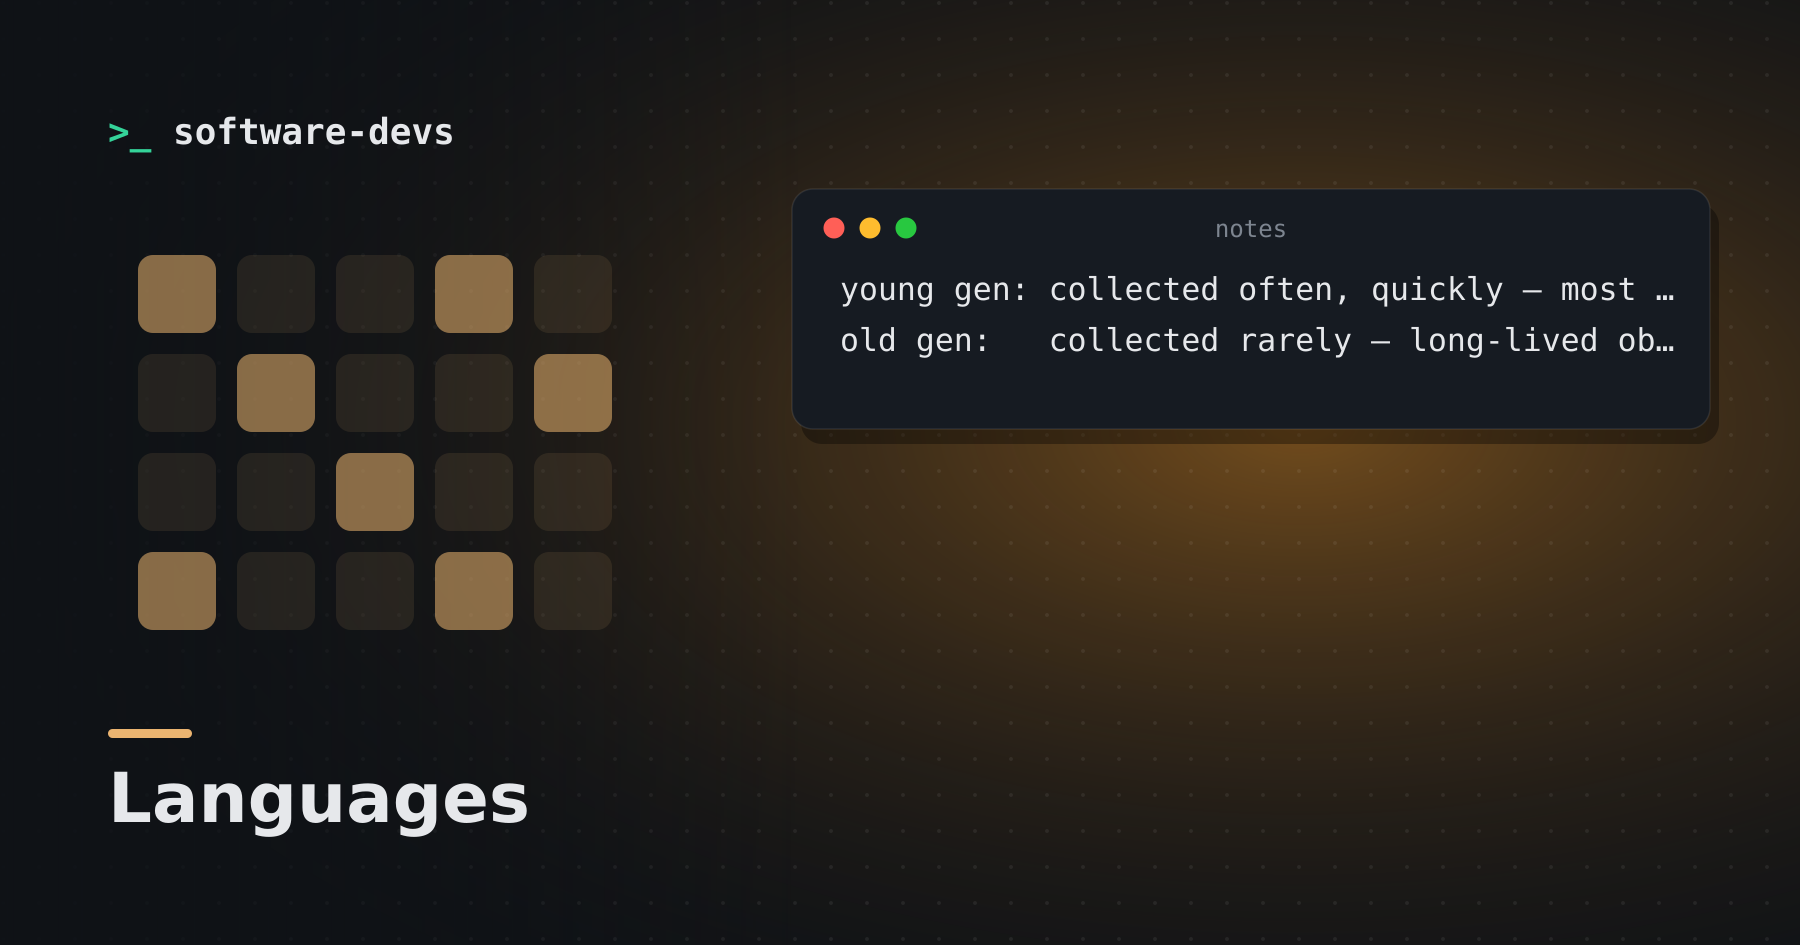
Most objects die young: temporary strings, request objects, iterators. Generational collectors exploit that:
young gen: collected often, quickly — most objects die here
old gen:   collected rarely — long-lived objects get promoted
Collecting the small young generation is fast, so most pauses are short.
Concurrent and incremental collectors
Modern collectors do most of their marking while your program keeps running, with only brief stop-the-world phases. This trades some throughput and memory for much lower pause times — the right trade for servers with latency targets.
Practical tuning
- Allocate less in hot paths. Fewer objects means less GC work.
- Watch heap metrics — collection frequency, pause durations and heap size after collection.
- Beware of leaks caused by long-lived references: global caches, event listeners, memoized maps that grow forever.
- Tune last. Defaults are good; change heap and collector settings only with measurements.
GC doesn't make memory free — it makes memory safe. Knowing how your runtime collects helps explain the occasional latency spike.